TRACKING COVID-19 DATA REPORTING & ANALYSIS IN THE U.S.: August 2020
Inadequate and incomplete COVID-19 data reporting has left governments and health officials ill-equipped, lacking the most basic information they need to make real-time decisions to anticipate, control, and mitigate the spread of coronavirus in the United States. Population Council researchers conducted a comprehensive analysis of 72 COVID-19 data sources from the Centers for Disease Control and Prevention (CDC) and health departments across 50 states and the District of Columbia (DC), 10 major cities, and 10 “hot spots” to assess how data is reported on COVID-19 testing and four outcomes: cases, hospitalizations, recoveries, and deaths. We examined completeness in data reporting and disaggregation of COVID-19 testing and outcomes by a core set of demographic indicators, such as age, race/ethnicity, sex/gender, geography, and underlying health conditions. This analysis also examined variations in data reporting and changes over the course of the pandemic, by comparing data between August and May, 2020.
Charlotte Brasseux, MPH Candidate, Mailman School of Public Health at Columbia University
Mingqi Song, MPA, School of International and Public Affairs at Columbia University
Thoai D. Ngo, PhD, MHS, Poverty, Gender and Youth Program & GIRL Center, Population Council

KEY FINDINGS
COVID-19 data reporting across 72 data sources in the United States remains incomplete with slight improvements over a three-month period
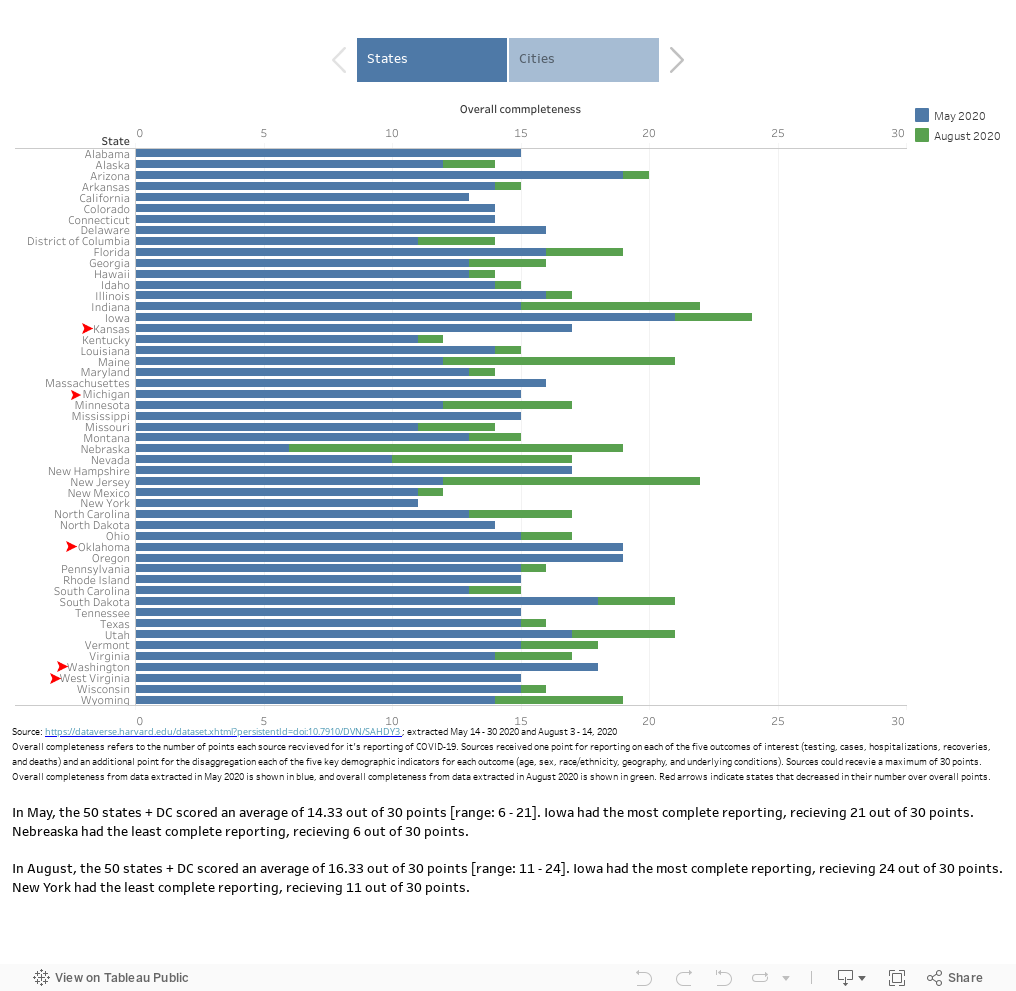
Incomplete data reporting : In August, 50 states and DC scored an average of 16.3 out of the 30 points for overall data completeness- a slight increase from a score of 14.3 points in May.
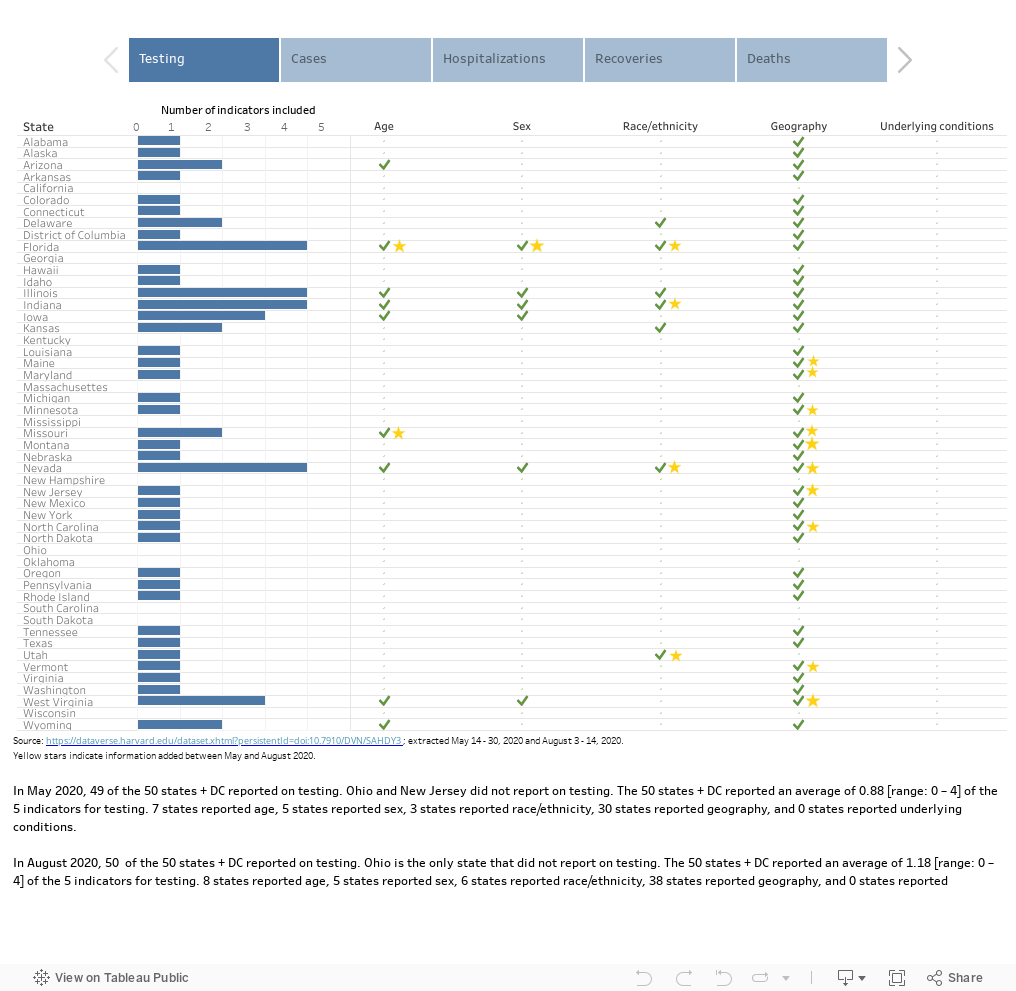
Slight improvements in reporting of COVID-19 testing and outcomes: In August, 35 of the 50 states and DC reported data on testing, cases, hospitalizations, recoveries, and deaths - a small increase from 31 states in May. While the number of states and DC reporting on cases (50 states + DC), hospitalizations (48), and deaths (5) remained the same, the number of data sources reporting on testing increased from 49 to 50 and on recoveries from 32 to 38.
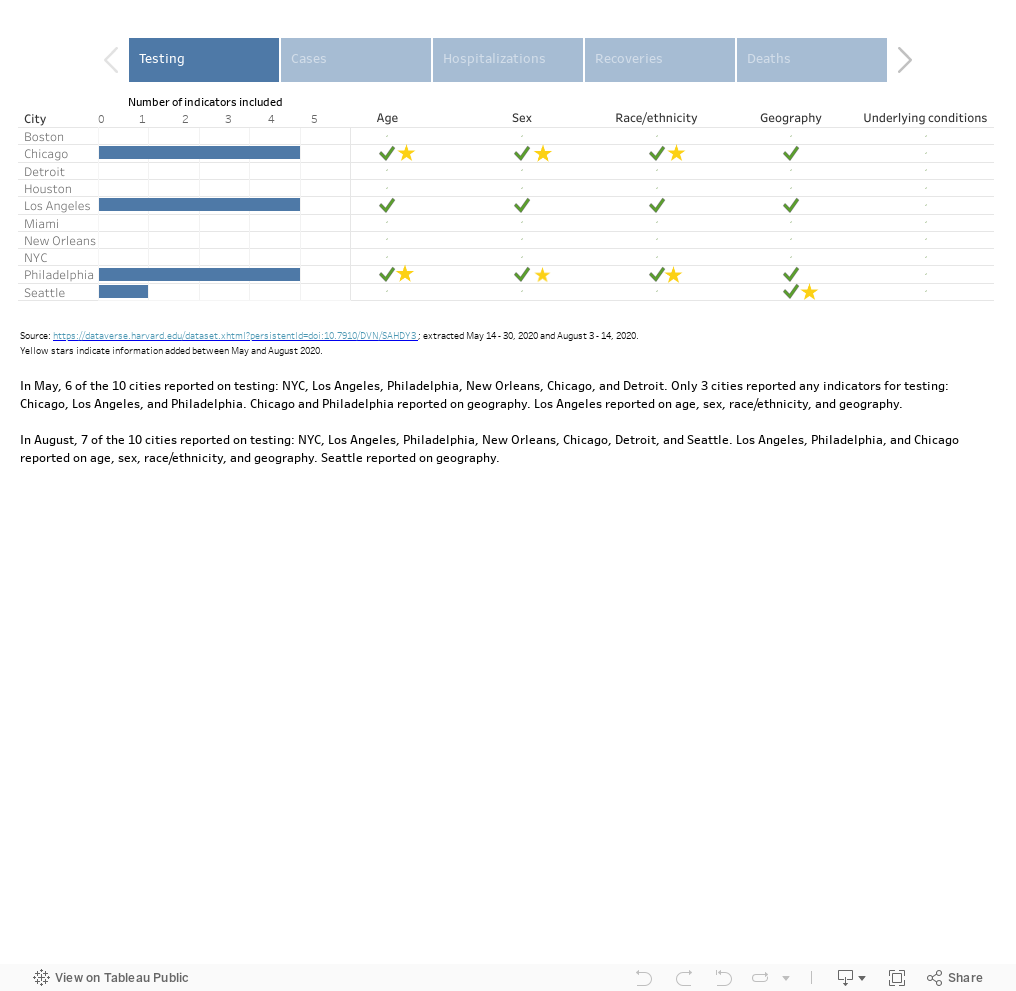
Marked improvements in the disaggregation of COVID-19 testing and outcomes by demographic indicators: Across the 50 states and DC, 13 states improved in their disaggregation of data for testing, 11 for cases, 16 for hospitalizations, 10 for recoveries, and 17 for deaths. Of the 10 cities, 3 cities improved in their disaggregation of data for testing, 2 for hospitalizations, 3 for deaths, and none for cases or recoveries.
Hot spot county-level data was severely incomplete: Hot spots received an average of 5.8 out of 30 points [range: 3 - 8], and disaggregation of demographic indicators was lacking. Only cases and deaths had any disaggregation by demographic indicators.
Inadequate reporting of social indicators associated with health equity continues
The percent of the 72 data sources that include intersectional analysis in their data reports rose from 31% to 52%. This slight improvement is inadequate and hinders our understanding of drivers of inequity related to COVID-19 testing and outcomes.
While six states and cities claimed to have started collecting data on gender identity and sexual orientation, no sources reported this data – limiting our understanding of how COVID-19 is affecting sexual and gender minority communities.
Only 19 states and cities developed health equity taskforces to address the needs of marginalized and minority populations, and even these data sources failed to include social indicators related to health equity. Data on race and ethnicity are inconsistently and poorly reported, restricting our ability to understanding the racial disparities of COVID-19.
Extraordinary variations remain in reporting of COVID-19 data, including differences in definitions of outcomes and indicators, what data is being reported, and where data is being reported
Data sources presented data in a different way across different interfaces, COVID-19 daily or weekly reports and dashboards, and webpages. Many sources presented data on multiple dashboards or updated data in different frequencies for reports and dashboards, making it difficult to concisely locate all available information.
The definitions of COVID-19 outcomes remain varied and unclear across data sources. For instance, there are at least 18 different definitions for “recoveries.” Some sources used other terms (e.g., hospital discharge); and, 17 sources (12 states and 5 cities) did not specify how they defined “recoveries” on their websites.
Data on place of stay, exposures, and health care workers was not standardized across all sources, limiting our understanding on the location of outbreaks to improve contact tracing efforts.
OVERALL DATA COMPLETENESS
In August, 50 states and DC scored an average of 16.3 out of the 30 points for overall data completeness - a slight increase from a score of 14.3 points in May.
DISAGGREGATION BY KEY DEMOGRAPHIC INDICATORS
We observed improvements in the disaggregation of COVID-19 testing and outcomes by demographic indicators; however, they remain limited.
HOT SPOTS ANALYSIS
Using the New York Times Coronavirus Map and Case Count, we identified the top ten hot spots on August 3rd as Madison, TX; Chicot, AR; Sharkey, MS; Chattahoochee, GA; George, MS; Jefferson, FL; Cibola, NM; Tallahatchie, MS; Gulf, FL; and Cameron, TX. Hot spots are defined as counties with the highest number of recent cases per resident over the past seven days.
County-level data was overwhelmingly incomplete: Hot spots received an average of 5.8 out of 30 points [range: 3 - 8] and disaggregation of demographic indicators was lacking. Only cases and deaths had any disaggregation of demographic indicators.
Of these ten hot spots, only Madison, TX reported data on coronavirus at the county level. For the other nine hot spots, county level data could only be found through the state health department website. Without county-level data, it is challenging to pinpoint the extent of the disparities exposed by COVID-19.
INTERSECTIONAL ANALYSIS OF EQUITY INDICATORS
38 of the 72 data sources (an increase from 31% in May to 52% in August) examined the intersection of more than one key demographic indicator by an outcome. These data sources include those from the CDC, 31 states (an increase from 30% in May to 62% in August), District of Columbia, four cities (25%), and one hot spot.

Arizona, Florida, Indiana, Iowa, Kansas, Maryland, Michigan, Minnesota, New Jersey, North Carolina, Washington and Wyoming are the sources that began including intersectional analysis following our first analysis conducted in May.
The CDC, Arizona, Florida, Iowa, Illinois, Indiana, Iowa and North Carolina made the most substantial progress in reporting intersectional analyses.
Chicago no longer reports intersectional analyses.
34 sources shared intersectional analysis for cases and 24 for deaths, while only 7 for testing, 10 for hospitalizations, and 3 for recoveries:
13 sources reported intersectionality for one outcome, 10 for two outcomes, 11 for three outcomes, and 3 (Arizona, Indiana, and Iowa) for four outcomes. In May, zero sources reported more than three outcomes.
“Underlying health conditions” remains the least reported and analyzed indicator compared to other demographic indicators compared to our May analysis:

The CDC reported intersectional analysis for hospitalizations by race/ethnicity and underlying health conditions, which was not recorded in May. Iowa is the only source that reported this information regarding underlying health conditions for recoveries.
Sex is the least examined indicator for all four COVID-19 outcomes in August; whereas geography was the indicator reported by the fewest sources in May.
11 of the 38 sources (29%) didn’t include race/ethnicity in their intersectional analysis of any outcome, a slight decrease from May (33%)
“Age + geography” and “race/ethnicity + geography” were still the most common combinations across the 38 data sources, followed by “sex + geography”.

Five data sources cross-examined three indicators for at least one outcome. For instance, Houston reported cases, hospitalization, and deaths cross-tabulated by three indicators (age, sex, and race/ethnicity). Some sources reported more detailed data: Georgia and Michigan both revealed the detailed data of COVID-related deaths by cross-examining four demographic indicators. In May, we didn’t identify any sources with this level of thoroughness in intersectional analysis.
Recommendations
States and cities need to standardize and advance more thorough data reporting of COVID-19 testing, cases, hospitalizations, recoveries, and deaths along with key demographic and exposure indicators. A comprehensive profile of COVID-19 cases is crucial to controlling infections and preventing new outbreaks.
States and cities must broaden their data reporting of sociodemographic factors that may drive vulnerability of COVID-19, including by collecting more data on sexual orientation and gender identity, separating race from ethnicity, examining poverty-level data, and conducting better intersectional analysis.
Cities and counties should also update COVID-19 data in a timely manner similar to what states have been doing. This is important for improving data accessibility for local citizens and the public.
The CDC should provide clear guidance on definitions to avoid misunderstandings in reporting, particularly for COVID-19 outcomes (e.g., recoveries and hospitalizations) and indicators (e.g. race/ethnicity, “place of stay”, “exposure”, and healthcare workers). Close collaboration between the CDC and local health department officials would strengthen data collection and analysis and be critical to improving contact tracing efforts and controlling the spread of COVID-19.
US states, cities and counties should improve the user-friendliness of data reports, including by adding the links to data resources on a single webpage, simplifying the types of data resources, and presenting all data in a coordinated way.
States and cities COVID-19 task forces or response teams should tackle inequities related to the pandemic with the mandate of more comprehensive COVID-19 data reporting and analysis. States must make data openly available and collaborate with researchers from universities and research institutions for more robust analyses.
RATIONALE
As of August 2020, the United States remains the epicenter for COVID-19 with the highest number of infections and deaths in the world. Previous analysis showed that reporting on COVID-19 data was incomplete and inadequate, limiting robust analyses that could guide a targeted pandemic response. Having the best data reporting and analysis at the local and national levels would guide containment efforts, build a more targeted response strategy, and foster learnings across cities and states as new hotspots arise.
OBJECTIVE
We assessed how COVID-19 data is reported and analyzed in the US at the national, state, city, and “hot spot” level. We examined data completeness and data disaggregation of COVID-19 testing, cases, hospitalizations, recoveries, and deaths by a core set of demographic indicators (i.e. age, race/ethnicity, sex/gender, geography, and underlying health conditions). We also explored the gaps in data reporting, how these official data sources examine the intersecting vulnerabilities of COVID-19, and how data reporting has changed over the course of the pandemic.
METHOD
We reviewed 72 COVID-19 data sources from the Centers for Disease Control and Prevention (CDC) and health departments across 50 states and the District of Columbia (DC), ten major cities in the United States, and ten “hot spots” identified between August 3 - 14, 2020. “Data sources” refer to daily and weekly COVID-19 reports along with COVID-19-specific webpages and dashboards accessed through the health department’s websites from the CDC, 50 states, nine territories, and ten cities. We extracted information on testing and outcomes of COVID-19: cases, hospitalizations, recoveries, and deaths. These are referred to as outcomes. We examined whether the sources disaggregated these outcomes by five demographic indicators: age, sex, race/ethnicity, geography, and underlying conditions. We also looked for data on place of stay, exposures, and healthcare workers.
To determine completeness and disaggregation, we looked for whether each source reported each of the five outcomes and whether each outcome was disaggregated by the 5 indicators. We gave each source one point for each outcome it reported (testing, cases, hospitalizations, recoveries, and deaths), and an additional point for each indicator it included for each outcome (age, sex, race/ethnicity, geography, and underlying conditions. Each source could receive up to 30 points.

This project was featured in Think Global Health. Read “Two Hundred Thousand and (Not) Counting” from authors, Thoai Ngo and Charlotte Brasseux.